Building Your First App for visionOS: Part 2
In part 1 of this tutorial, you learned how to set up a new visionOS project and create a basic user interface using SwiftUI. In this part, you'll learn how to use RealityKit and SwiftUI to display and animate a 3D bar chart in a visionOS app.
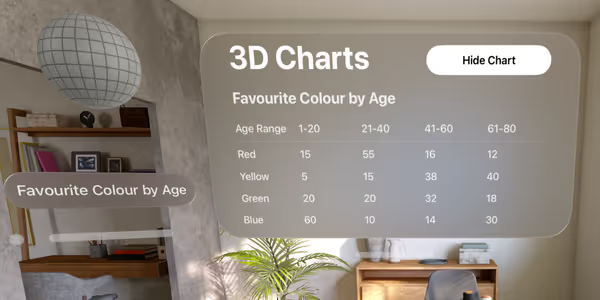
You can pickup this tutorial using the code you wrote in part 1, or download the finished project from part 1 here. After part 1 you should have a project that looks like this:
Adding a 3D bar chart #
When the user toggles the “Show Chart” button we're going to draw a 3D bar chart representing our data in the volumetric window. Since our chart will be made up of a collection of 3D objects, we'll create a root Entity in our AppState that will hold all the chart objects.
 // AppState.swift
 import Foundation
+import RealityKit

 @Observable
 public class AppState {
     var isShowingChart = false
     var chartTitle = ""
     var chartContent: ChartContent = []
+    var chart = Entity()
+
+    init() {
+        // Position the chart near the bottom of the volume
+        chart.transform.translation.y -= 0.23
+    }
 }
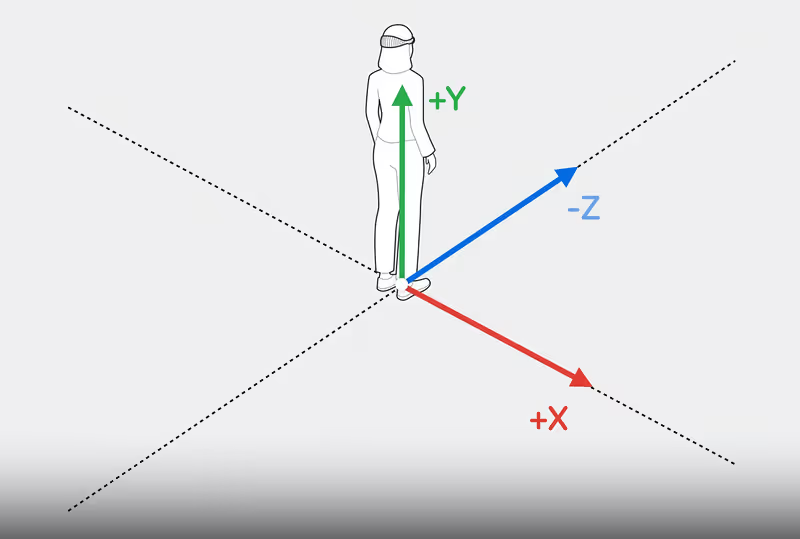
Entity is a holder for 3D objects in RealityKit. We're going to make all the entities in our chart children of this root entity, that way we can manipulate the entire chart as a single object. When we first add the chart: Entity to the RealityView it's position (translation) will be in the center of the volume. Since our volume is 0.5 meters in height we move the chart down by 0.23 meters to position it near the bottom of the volume. It's helpful to keep in mind the coordinate space:
Next, we'll add the chart to our RealityView:
 // ChartView.swift
 struct ChartView: View {

     var body: some View {
         RealityView { content in
-            if let entity = await loadEntity() {
-                content.add(entity)
-                entity.transform.translation.y -= 0.1
-            }
+            content.add(appState.chart)
+        } update: { content in
+            appState.updateChart()
         }
         .toolbar {
             ToolbarItemGroup(placement: .bottomOrnament) {
We've also added an update block to our RealityView. This allows us to update the chart when the app state changes. Any changes to app state properties within updateChart will cause update to be called. We'll implement updateChart in a moment.
Drawing the chart #
Before we draw the chart, we need to add to an Entity to our ChartData to represent each cell as a 3D object. Open ChartContent.swift and add the following code:
 // ChartContent.swift

 import Foundation
+import RealityKit

 /// Represents a cell in the chart
 @Observable
 class ChartData {
     /// The value held this cell in the chart
     var value: String
     /// The value as a `Float` or `0` if not a number
     var floatValue: Float {
         Float(value) ?? 0
     }
+    /// Represents the data as a 3D object in a RealityKit scene
+    var entity: Entity?

     init(value: String) {
         self.value = value
NOTE: We're going to make some assumptions about our chart:
- We're going to treat the first
ChartRowas a row of headings for one axis of the chart. - The first
ChartDatain each row will be the headings for the other axis. - We'll also assume that all the values in the chart are positive numbers.
Create a new Swift file called AppState+ChartDrawing.swift and add the following code:
// AppState+ChartDrawing.swift
import Foundation
import UIKit
import RealityKit
fileprivate extension ChartContent {
var maxChartValue: Float {
var result: Float = 0
// Drop headings
for row in dropFirst() {
for col in row.data.dropFirst() {
result = Swift.max(result, col.floatValue)
}
}
if result <= 0 {
result = 1
}
return result
}
}
fileprivate var chartBoundsDidChange = true
extension AppState {
/// The width and depth of a bar in meters
private var barSize: Float { 0.05 }
/// The height of a bar in meters
private var barHeight: Float { barSize * 5 }
/// The size of the gutters in between the bars
private var barPadding: Float { barSize * 0.8 }
/// The minimum height of a bar
private var minBarScale: Float { 0.042 }
private enum ChartColors {
case red
case yellow
case green
case blue
var uiColor: UIColor {
switch self {
case .red:
return .red
case .yellow:
return .yellow
case .green:
return .green
case .blue:
return .blue
}
}
static var all: [ChartColors] {
[
.red,
.yellow,
.green,
.blue,
]
}
}
func updateChart() {
// Calculate the greatest value to determine the height of the chart
let maxChartValue = chartContent.maxChartValue
chartContent.dropFirst().enumerated().forEach { rowIndex, row in
draw(chartRow: row,
maxChartValue: maxChartValue,
rowIndex: rowIndex)
}
if chartBoundsDidChange {
let bounds = chart.visualBounds(relativeTo: nil).extents
// Position the middle of the chart in the middle of the volumne
chart.transform.translation.x = -1 * bounds.x * 0.5
chart.transform.translation.z = -1 * bounds.z * 0.5
chartBoundsDidChange = false
}
}
private func draw(chartRow row: ChartRow,
maxChartValue: Float,
rowIndex: Int) {
let color = ChartColors.all[rowIndex].uiColor
row.data.dropFirst().enumerated().forEach { colIndex, data in
// Determines the height of the bar
let scale = max(data.floatValue / maxChartValue, minBarScale)
drawCell(data: data,
scale: scale,
color: color,
rowIndex: rowIndex,
colIndex: colIndex)
}
}
private func drawCell(data: ChartData,
scale: Float,
color: UIColor,
rowIndex: Int,
colIndex: Int) {
// Create the entity if needed
let entity = data.entity ?? {
chartBoundsDidChange = true
// Create a model entity for the bar
let mesh = MeshResource.generateBox(width: barSize,
height: barHeight,
depth: barSize)
let colorMaterial = SimpleMaterial(color: color,
roughness: 0.3,
isMetallic: false)
let entity = ModelEntity(mesh: mesh, materials: [colorMaterial])
// Set the height of the bar
entity.transform.scale.y = scale
// Align the bars vertically
entity.transform.translation.y = barHeight * scale * 0.5
// Position the bar in row and column position
let x = (barSize + barPadding) * Float(colIndex) + barSize * 0.5
let z = (barSize + barPadding) * Float(rowIndex) + barSize * 0.5
entity.transform.translation.x = x
entity.transform.translation.z = z
// Add the entity to the chart
chart.addChild(entity)
// Store the new entity in this ChartData
data.entity = entity
return entity
}()
// Change the height of the bar if needed
if entity.transform.scale.y != scale {
var transform = entity.transform
transform.scale.y = scale
transform.translation.y = barHeight * scale * 0.5
// Animate the bar height changes
let anim = FromToByAnimation(from: entity.transform,
to: transform,
bindTarget: .transform)
if let res = try? AnimationResource.generate(with: anim) {
entity.playAnimation(res)
}
}
}
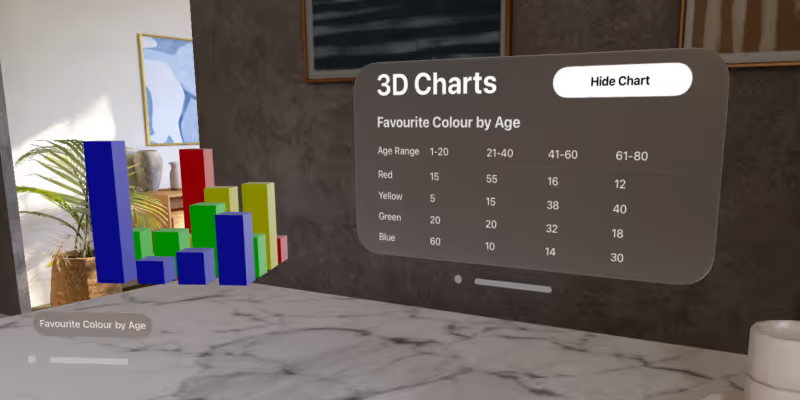
}For each cell we create a ModelEntity representing a bar in the chart using MeshResource to generate a box shape and SimpleMaterial to give it some color. We modify the entity transform to position each bar in row and column position, set it's height and align the bars so that they sit on the floor of the volume. When the height of a bar changes we use a simple UIKit animation to animate the change.
Run the app and you should see a 3D bar chart in the volumetric window. Make changes to the data to see the chart update. The app should look like this:
Drawing a base plate #
The next thing we want is to be able to label the chart. We'll start by adding a base plate to the chart so our text will stand out and the chart will feel more cohesive.
First, modify the AppState.swift file to include a new stored property for our base plate:
 // AppState.swift
 public class AppState {
     var chartTitle = ""
     var chartContent: ChartContent = []
     var chart = Entity()
+    var basePlate: Entity?

     init() {
         // Position the chart near the bottom of the volume
Next, we'll make a few modifications to AppState+ChartDrawing.swift.
First we add new properties to the AppState extension for the base plate:
 // AppState+ChartDrawing.swift
     private var barPadding: Float { barSize * 0.8 }
     /// The minimum height of a bar
     private var minBarScale: Float { 0.042 }
+    /// The distance between the edge of the base plate and the chart content
+    private var basePlatePadding: Float { 0.1 }
+    /// The thickness of the base plate
+    private var basePlateHeight: Float { 0.02 }

     private enum ChartColors {
         case red
Then we'll call a new method in updateChart when the chart bounds change to draw the base plate:
         if chartBoundsDidChange {
+            basePlate?.removeFromParent()

             let bounds = chart.visualBounds(relativeTo: nil).extents

+            drawBasePlate(inBounds: bounds)
+
             // Position the middle of the chart in the middle of the volumne
             chart.transform.translation.x = -1 * bounds.x * 0.5
             chart.transform.translation.z = -1 * bounds.z * 0.5
We have to remove the base plate from the chart before we calculate the chart bounds, otherwise the base plate will include itself and grow each time the chart bounds change.
Finally, we'll implement the drawBasePlate method:
private func drawBasePlate(inBounds bounds: SIMD3<Float>) {
    // Add padding to the chart bounds
    let basePlateBounds = bounds + SIMD3<Float>(repeating: basePlatePadding)

    let mesh = MeshResource.generateBox(width: basePlateBounds.x,
                                        height: basePlateHeight,
                                        depth: basePlateBounds.z,
                                        cornerRadius: basePlateHeight * 0.5)
    let colorMaterial = SimpleMaterial(color: .white,
                                       roughness: 0.1,
                                       isMetallic: false)
    let basePlate = ModelEntity(mesh: mesh, materials: [colorMaterial])
    chart.addChild(basePlate)

    // Position the middle of the base plate in the middle of the chart
    basePlate.transform.translation.x += bounds.x * 0.5
    basePlate.transform.translation.z += bounds.z * 0.5

    self.basePlate = basePlate
}
We use the chart bounds to calculate the size of the base plate based on the content of the 3D chart. The bounds of the chart include the bounds all it's descendants, so it is convenient to use this to calculate the size required for the base plate.
Labelling the rows #
We want to draw 3D text on our chart to label the axes. Remember we are considering the first row of the chart to be the headings for one axis and the first column in each row to be the headings for the other axis. We'll draw the headings for the first row after the other rows so it is toward the user in the z-direction. We'll draw the headings for each row after each row in the x-direction because it makes the chart positions easy to calculate.
Call a new method called drawHeading for each chart row:
 // AppState+ChartDrawing.swift
     private func draw(chartRow row: ChartRow,
                       maxChartValue: Float,
                       rowIndex: Int) {
         let color = ChartColors.all[rowIndex].uiColor

         row.data.dropFirst().enumerated().forEach { colIndex, data in
             // Determines the height of the bar
             let scale = max(data.floatValue / maxChartValue, minBarScale)

             drawCell(data: data,
                      scale: scale,
                      color: color,
                      rowIndex: rowIndex,
                      colIndex: colIndex)
         }
+
+        drawHeading(forChartRow: row, rowIndex: rowIndex)
     }
Implement the new method to draw the headings:
private func drawHeading(forChartRow row: ChartRow, rowIndex: Int) {
    guard let heading = row.data.first else {
        assertionFailure("ChartRow should have a heading")
        return
    }

    // If the heading value changed, remove the entity and redraw it
    if let entity = heading.entity,
       entity.name != heading.value
    {
        chart.removeChild(entity)
        heading.entity = nil
    }

    // Create a new heading entity if needed
    _ = heading.entity ?? {
        chartBoundsDidChange = true

        let entity = createLabelEntity(forHeading: heading)
        chart.addChild(entity)

        // Position the heading after the row
        let bounds = entity.visualBounds(relativeTo: nil).extents
        let cellSize = barSize + barPadding
        let rowMaxX = cellSize * Float(row.data.count - 1) - barPadding
        let rowZ = cellSize * Float(rowIndex)
        entity.transform.translation.y = basePlateHeight * 0.5
        entity.transform.translation.x = rowMaxX + basePlatePadding * 0.25
        entity.transform.translation.z = rowZ + barSize - bounds.y

        return entity
    }()
}

private func createLabelEntity(forHeading heading: ChartData) -> Entity {
    let mesh = MeshResource.generateText(heading.value,
                                         extrusionDepth: 2)
    let colorMaterial = SimpleMaterial(color: .black,
                                       isMetallic: false)
    let entity = ModelEntity(mesh: mesh, materials: [colorMaterial])

    // Store the heading value in the name to compare later
    entity.name = heading.value
    // Size the text appropriately for the chart
    entity.scale *= 0.002
    // Rotate the text by 90 degrees to lay flat
    entity.orientation = simd_quatf(angle: -1 * .pi * 0.5,
                                    axis: [1, 0, 0])
    // Store the new entity in this ChartData
    heading.entity = entity

    return entity
}
When we create text mesh using MeshResource.generateText the text will be vertically oriented along the y-axis from the user's perspective. We rotate the text by 90 degrees around the x-axis to lay it flat on the base plate. This can be done in a few ways but here we use a simple quaternion to set the appropriate orientation. When we position the text along the z-axis we are using the y bounds of the text entity since we rotated it.
Now run the app and you should see the headings appear after each row on the base plate. When you make a change to the row label the 3D chart should update and redraw.
Labelling the columns #
Now we're going to draw the headings for the columns contained in the first row of chart data. We'll draw the column headings after the data rows. First, call a new method after the chart rows are drawn:
 // AppState+ChartDrawing.swift
     func updateChart() {
         // Calculate the greatest value to determine the height of the chart
         let maxChartValue = chartContent.maxChartValue

         chartContent.dropFirst().enumerated().forEach { rowIndex, row in
             draw(chartRow: row,
                  maxChartValue: maxChartValue,
                  rowIndex: rowIndex)
         }

+        drawChartHeadings()
+
         if chartBoundsDidChange {
             basePlate?.removeFromParent()
Next we'll draw the column headings, reusing the existing createLabelEntity method:
private func drawChartHeadings() {
    guard let headingsRow = chartContent.first else {
        assertionFailure("A chart should always have at least one row")
        return
    }

    let rowCount = chartContent.count - 1
    headingsRow.data.dropFirst().enumerated().forEach { colIndex, column in
        // If the heading value changed, remove the entity and redraw
        if let entity = column.entity,
           entity.name != column.value
        {
            chart.removeChild(entity)
            column.entity = nil
        }

        // Create a new heading entity if needed
        _ = column.entity ?? {
            chartBoundsDidChange = true
            let entity = createLabelEntity(forHeading: column)
            chart.addChild(entity)

            // Position the heading row after the other rows
            let bounds = entity.visualBounds(relativeTo: nil).extents
            let cellSize = barSize + barPadding
            let colX = cellSize * Float(colIndex) + barSize * 0.5
            let colMaxZ = cellSize * Float(rowCount) - barPadding
            let y = basePlateHeight * 0.5
            let x = colX - bounds.x * 0.5
            let z = colMaxZ + barSize * 0.5 + basePlatePadding * 0.25
            entity.transform.translation.y = y
            entity.transform.translation.x = x
            entity.transform.translation.z = z

            return entity
        }()
    }
}
Testing the 3D chart #
We now have a functional labelled 3D bar chart that updates when the data changes. Run the app and see what the chart looks like. Play around with it and trying changing various values to see how it behaves. At this point the chart should look like this:
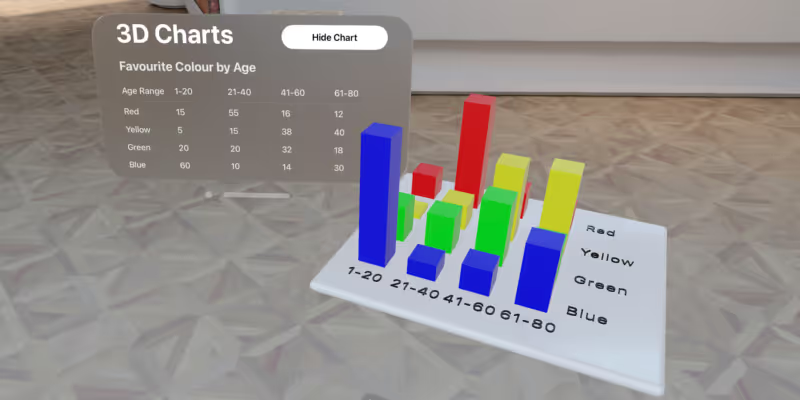
You might notice some limitations of the chart. For example, the column headings will quickly run into each other if they contain too much text. If you create a very long row label, then the chart will become too large to fit in the 3D volume and will be clipped by the window. The chart also would represent values very well if one value is much larger than the others. It would also be nice to have a mechanism to add and delete rows and columns from the chart.
Test out the app yourself and see if you can find any other issues or room for improvement. It's important to continuously run and test your app as well as get feedback from users so your app will consistently improve.
Next Steps #
You've now learned everything you need to know to create a basic visionOS app. You've learned how to create flat and volumetric windows and populate them using SwiftUI views and RealityKit entities. You've learned how to represent your data as app state to keep your UI in sync and animate updates. You've also learned how to create basic meshes and materials and how to manipulate them in a 3D scene. Further tutorials in this series will expand on the capabilities of visionOS and add depth to your app.
You can download the finished project from part 2 of the tutorial here. The full source code for the 3D charts tutorial can be found on GitHub.
In part 3 we will add functionality to the app and improve the visuals of the 3D chart.