Building Your First App for visionOS: Part 1
In this tutorial series you will learn how to build a complete app for visionOS using SwiftUI and RealityKit. You will learn how to create a new visionOS project, how to build an interface for visionOS using SwiftUI and how to display and animate 3D content using RealityKit. This tutorial will get you started building apps for visionOS right away and provide a solid foundation to learn from.
We will build a spreadsheet app that displays 3D charts. The app will include a spreadsheet like interface and a 3D bar chart. It will look something like this:
New visionOS project #
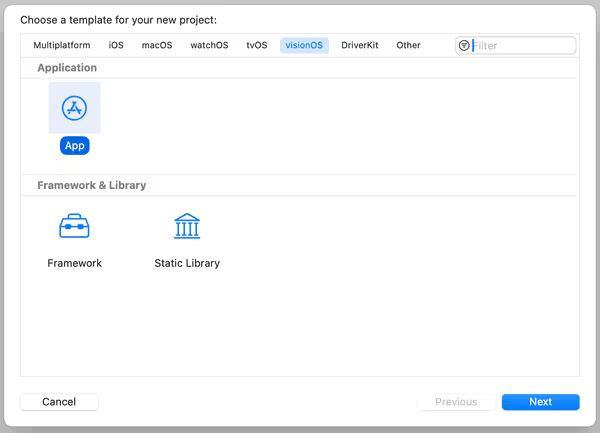
To create a new visionOS project, open Xcode and select File/New/Project (⇧⌘N). Select the “visionOS” tab and choose the “App” template.
Click “Next” and then choose options for your new project:
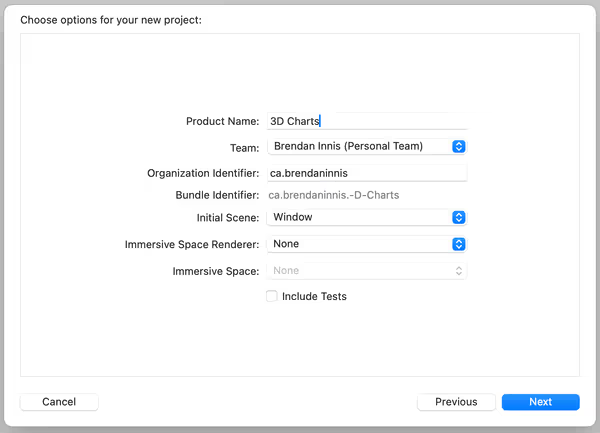
- Product Name: 3D Charts (This will be the name of your app)
- Team: [Your Team] (You will need to sign in with your Apple ID if you haven't already)
- Organization Identifier: [Your reversed domain] (To uniquely identify your app)
- Initial Scene: Window (We'll display our spreadsheet using SwiftUI)
- Immersive Space Renderer: None (We're going to display our 3D content in a Volumetric Window)
- Immersive Space: Mixed (We can introduce a mixed reality space later in the project)
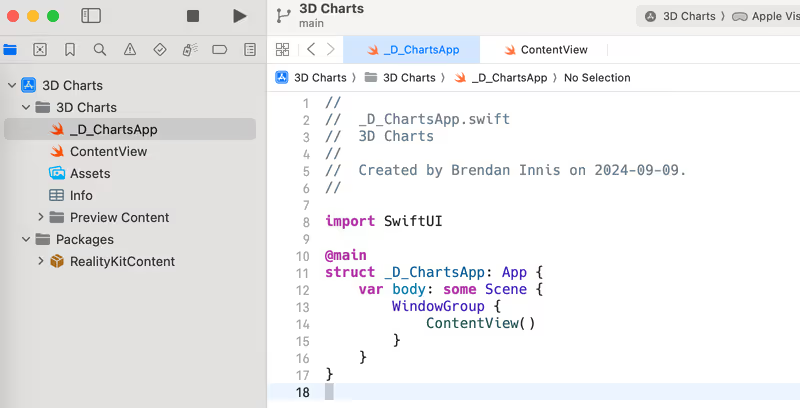
Exploring the new visionOS project #
The template visionOS project creates an app that shows a 3D model in a window using SwiftUI. The project also includes a Reality Composer Pro package called RealityKitContent that includes a scene with a 3D model and texture. Reality Composer Pro is a standard way to include 3D content in your visionOS app. It can be found by selecting Xcode/Open Developer Tool/Reality Composer Pro.
The first thing you should do when you create a new project is to run it and understand how the code works. Press “Run” and let Xcode boot up the visionOS simulator and launch the app. Once you've launched the app and confirmed that it runs, we can start making changes.
Starting from scratch #
Since I chose “3D Charts” as the name of my app, I have to clean up my App file a bit. We can also add a volumetric window that we'll use later to display the 3d charts.
- Select the
Appfile in the project navigator:
- Make changes to the
Appfile:
- Rename the
Appstruct toThreeDeeChartsAppand the file to ThreeDeeChartsApp.swift. - Create a new
@Stateproperty calledappStateand set it as the environment forContentView. - Create an empty volumetric window that we'll use later to display the 3D charts.
// After
import SwiftUI

@main
struct ThreeDeeChartsApp: App {
    @State private var appState = AppState()

    var body: some Scene {
        WindowGroup {
            ContentView()
                .environment(appState)
        }
        .windowResizability(.contentSize)

        WindowGroup {
            // 3D charts will go here
        }
        .windowStyle(.volumetric)
    }
}- Create a new file called AppState.swift.
AppStatewill be an@Observableclass to keep track of our app state including the chart data and UI state. For now, we'll add aStringto keep track of our chart's title.
// AppState.swift
import Foundation

@Observable
public class AppState {
    var chartTitle = ""
}- Open the ContentView.swift file.
- Create an
@Environmentproperty to access theAppStateobject. - We're going to create a vertical stack of the app title, the chart title and the chart data. We'll add some basic styling for now and add a
glassBackgroundEffet()to the preview so we can easy see the UI rendered in Xcode canvas. - We also need to make the
appStatebindable so theTextFieldcan update thechartTitleproperty.
// ContentView.swift
import SwiftUI

struct ContentView: View {
    @Environment(AppState.self) private var appState

    var body: some View {
        @Bindable var appState = appState
        VStack(alignment: .leading) {
            Text("3D Charts")
                .font(.extraLargeTitle)
                .padding(.bottom, Constants.verticalSpacing)
            TextField("Chart Title", text: $appState.chartTitle)
                .font(.title)
                .frame(maxWidth: 480)
                .padding(.bottom, Constants.verticalSpacing)

        }
        .padding(EdgeInsets(top: Constants.verticalSpacing,
                            leading: Constants.horizontalMargin,
                            bottom: Constants.verticalSpacing,
                            trailing: Constants.horizontalMargin))
    }
}

#Preview {
    return ContentView()
        .glassBackgroundEffect()
        .environment(AppState())
}- Finally, create a Constants.swift file to store some values we'll reuse throughout the app.
// Constants.swift
import Foundation

enum Constants {
    static let verticalSpacing: CGFloat = 8
    static let horizontalMargin: CGFloat = 48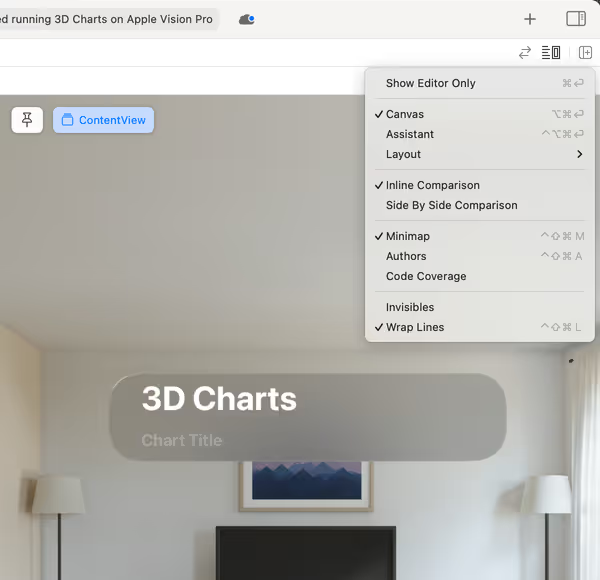
}- Now switch back to ContentView.swift and enable the Canvas by selecting it from the “Adjust Editor Options” menu in the top right corner of the Xcode window (⌥⌘↩). The Canvas is useful for previewing changes to your SwiftUI code as you write it. You can also interact with the “Chart Title”
TextFieldand change it's value.
Building the spreadsheet UI #
We need a way to enter data for our 3D charts. We're going to create a grid of rows and columns with text fields where the user can enter data and store that data in our AppState.
- First create a new file called ChartContent.swift. We'll create some data structures to contain our chart data. We store the chart data as a string so we can hold values like headings, but we'll add a property to access the value as a
Floatwhich we can use to draw our chart. We're going to make the data@Observableso the UI will be updated when the data changes.
// ChartContent.swift
import Foundation

/// Represents a cell in the chart
@Observable
class ChartData {
    /// The value held this cell in the chart
    var value: String
    /// The value as a `Float` or `0` if not a number
    var floatValue: Float {
        Float(value) ?? 0
    }

    init(value: String) {
        self.value = value
    }
}

/// Represents a row of chart data
@Observable
class ChartRow {
    /// The data held in each column of this row
    var data: [ChartData]

    init(data: [ChartData]) {
        self.data = data
    }
}

/// Represents all the data held in the chart
typealias ChartContent = [ChartRow]- Now we're going to add the chart content to our app state. Open AppState.swift and add a new property called
chartContentto hold the chart data. We'll also add a method to create some default data for our chart. This will make it easier to debug our UI in the Canvas Preview.
 // AppState.swift
 @Observable
 public class AppState {
     var chartTitle = ""
+    var chartContent: ChartContent = []
 }
+
+#if DEBUG
+extension AppState {
+    func preloadAppState() {
+        chartTitle = "Favourite Colour by Age"
+        chartContent = [
+            ChartRow(data: [ChartData(value: "Age Range"),
+                            ChartData(value: "1-20"),
+                            ChartData(value: "21-40"),
+                            ChartData(value: "41-60"),
+                            ChartData(value: "61-80")]),
+            ChartRow(data: [ChartData(value: "Red"),
+                            ChartData(value: "15"),
+                            ChartData(value: "55"),
+                            ChartData(value: "16"),
+                            ChartData(value: "12")]),
+            ChartRow(data: [ChartData(value: "Yellow"),
+                            ChartData(value: "5"),
+                            ChartData(value: "15"),
+                            ChartData(value: "38"),
+                            ChartData(value: "40")]),
+            ChartRow(data: [ChartData(value: "Green"),
+                            ChartData(value: "20"),
+                            ChartData(value: "20"),
+                            ChartData(value: "32"),
+                            ChartData(value: "18")]),
+            ChartRow(data: [ChartData(value: "Blue"),
+                            ChartData(value: "60"),
+                            ChartData(value: "10"),
+                            ChartData(value: "14"),
+                            ChartData(value: "30")]),
+        ]
+    }
+}
+#endif
- Let's build the spreadsheet UI. Create a new SwiftUI View file called Spreadsheet.swift. We're going to display our chart content in a SwiftUI
Gridwith the cells as editableTextFieldviews so we can make changes to the data in our chart. We'll also add a divider after the first row to separate the headings from the data. Finally, we'll extendConstantswith values that will only be used in theSpreadsheetview and set up a#Previewwith our sample data along with some padding and background effect for readability.
// Spreadsheet.swift
import SwiftUI

struct Spreadsheet: View {
    @Environment(AppState.self) private var appState

    var body: some View {
        Grid(alignment: .leading,
             horizontalSpacing: Constants.cellBorderWidth,
             verticalSpacing: Constants.cellBorderWidth) {

            ForEach(Array(appState.chartContent.enumerated()),
                    id: \.offset) { rowIndex, row in

                GridRow {
                    ForEach(Array(row.data.enumerated()),
                            id: \.offset) { colIndex, data in

                        @Bindable var data = data
                        TextField("", text: $data.value)
                            .frame(width: Constants.cellWidth,
                                   height: Constants.cellHeight)
                    }
                }

                if rowIndex == 0 {
                    Divider()
                        .gridCellUnsizedAxes(.horizontal)
                        .padding(EdgeInsets(top: 0,
                                            leading: 4,
                                            bottom: 0,
                                            trailing: 4))
                }
            }
        }
    }
}

fileprivate extension Constants {
    static let cellBorderWidth: CGFloat = 4
    static let cellWidth: CGFloat = 100
    static let cellHeight: CGFloat = 32
}

#Preview {
    let appState = AppState()
    appState.preloadAppState()
    return Spreadsheet()
        .padding(EdgeInsets(top: 8, leading: 48, bottom: 8, trailing: 48))
        .glassBackgroundEffect()
        .environment(appState)
}- Now add the
Spreadsheetto the bottom of theVStackin ContentView.swift. Give it the same bottom vertical padding as the other views and setup the#Previewto preload the app state.
 // ContentView.swift
                 .font(.title)
                 .frame(maxWidth: 480)
                 .padding(.bottom, Constants.verticalSpacing)
+            Spreadsheet()
+                .padding(.bottom, Constants.verticalSpacing)

         }
         .padding(EdgeInsets(top: Constants.verticalSpacing,
                             leading: Constants.horizontalMargin,
                             bottom: Constants.verticalSpacing,
                             trailing: Constants.horizontalMargin))
     }
 }

 #Preview {
+    let appState = AppState()
+    appState.preloadAppState()
     return ContentView()
         .glassBackgroundEffect()
-        .environment(AppState())
+        .environment(appState)
 }
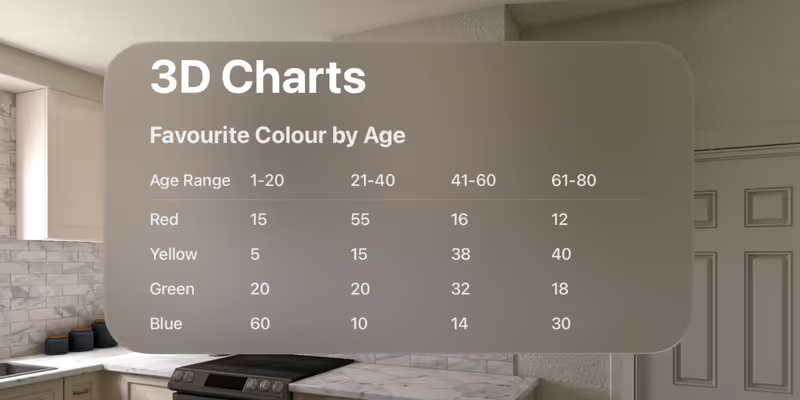
After that, run the Canvas Preview and your UI should look something like this:
Showing 3D content in a volumetric window #
You can use RealityKit to display 3D content in the user's physical space. We're going to use a volumetric window to show our 3D chart alongside other running application windows. We'll use a RealityView to display RealityKit content in our SwiftUI app.
- First, we need to keep track of whether the 3D chart is showing. Add a property called
isShowingChartto AppState.swift.
 // AppState.swift
 @Observable
 public class AppState {
+    var isShowingChart = false
     var chartTitle = ""
     var chartContent: ChartContent = []
 }
- Now we can create a toggle button in our UI to show and hide the 3D chart. Open ContentView.swift and add the
Togglein anHStackwith the app title. We'll use aSpacerto push theToggleto the trailing edge of the screen and use afixedSize()modifier on the parentVStackto keep theSpacerfrom taking up more space than it needs.
 // ContentView.swift
 struct ContentView: View {
     var body: some View {
         @Bindable var appState = appState
         VStack(alignment: .leading) {
-            Text("3D Charts")
-                .font(.extraLargeTitle)
-                .padding(.bottom, Constants.verticalSpacing)
+            HStack {
+                Text("3D Charts")
+                    .font(.extraLargeTitle)
+                    .padding(.bottom, Constants.verticalSpacing)
+                Spacer()
+                Toggle(isOn: $appState.isShowingChart) {
+                    if appState.isShowingChart {
+                        Text("Hide Chart")
+                            .frame(minWidth: 160)
+                    } else {
+                        Text("Show Chart")
+                            .frame(minWidth: 160)
+                    }
+                }
+                .toggleStyle(.button)
+            }
             TextField("Chart Title", text: $appState.chartTitle)
                 .font(.title)
                 .frame(maxWidth: 480)
                 .padding(.bottom, Constants.verticalSpacing)
             Spreadsheet()
                 .padding(.bottom, Constants.verticalSpacing)
         }
+        .fixedSize()
         .padding(EdgeInsets(top: Constants.verticalSpacing,
                             leading: Constants.horizontalMargin,
                             bottom: Constants.verticalSpacing,
- Open up your
Appfile again. We're going to observe the state ofisShowingChartand open and dismiss the volumetric window in response. We need to bring in the.openWindowand.dismissWindowenvironment actions to show and hide the window. We'll also pre-populate our app state when are running the app in debug, so we can easily see our spreadsheet data.
 @main
 struct ThreeDeeChartsApp: App {
-    @State private var appState = AppState()
+    @State private var appState: AppState = {
+        let appState = AppState()
+        #if DEBUG
+        appState.preloadAppState()
+        #endif
+        return appState
+    }()

+    @Environment(\.openWindow) private var openWindow
+    @Environment(\.dismissWindow) private var dismissWindow
+
     var body: some Scene {
         WindowGroup {
             ContentView()
                 .environment(appState)
+                .onChange(of: appState.isShowingChart) { oldValue, newValue in
+                    if newValue {
+                        openWindow(id: .chartWindow)
+                    } else {
+                        dismissWindow(id: .chartWindow)
+                    }
+                }
         }
+        .windowResizability(.contentSize)

-        WindowGroup {
-            // 3D charts will go here
-        }.windowStyle(.volumetric)
+        WindowGroup(id: .chartWindow) {
+            ChartView()
+                .environment(appState)
+        }
+        .windowStyle(.volumetric)
+        .defaultSize(width: 0.8, height: 0.5, depth: 0.8, in: .meters)
     }
 }
+
+typealias WindowId = String
+
+extension WindowId {
+    static let chartWindow = "ChartWindow"
+}
- Finally, we'll create one more SwiftUI
Viewfile called ChartView.swift. Here, we'll import RealityKit as well as our RealityKitContent package. For now, we'll just create aRealityViewand add the 3D model we still have in our content package to the scene. We will also add a toolbar window ornament to display the chart title. We also need to add an.onDisappearblock to track when the 3D chart is hidden.
import SwiftUI
import RealityKit
import RealityKitContent

struct ChartView: View {
    @Environment(AppState.self) private var appState

    var body: some View {
        RealityView { content in
            if let entity = await loadEntity() {
                content.add(entity)
                entity.transform.translation.y -= 0.1
            }
        }
        .toolbar {
            ToolbarItemGroup(placement: .bottomOrnament) {
                VStack (spacing: 12) {
                    Text(appState.chartTitle)
                }
            }
        }
        .onDisappear {
            appState.isShowingChart = false
        }
    }

    private func loadEntity() async -> Entity? {
        try? await Entity(named: "Scene", in: realityKitContentBundle)
    }
}

#Preview(windowStyle: .volumetric) {
    ChartView()
        .environment(AppState())
}
Now run the app and try it out! You should be able to toggle the volumetric window to show the 3D content. You can also make changes to the chart title and see it reflected in the toolbar ornament of the volumetric window.
Next steps #
In part 2 of this tutorial series we will learn how to create a 3D bar chart using RealityKit and SwiftUI. You can download the finished project from this part 1 of the tutorial here.